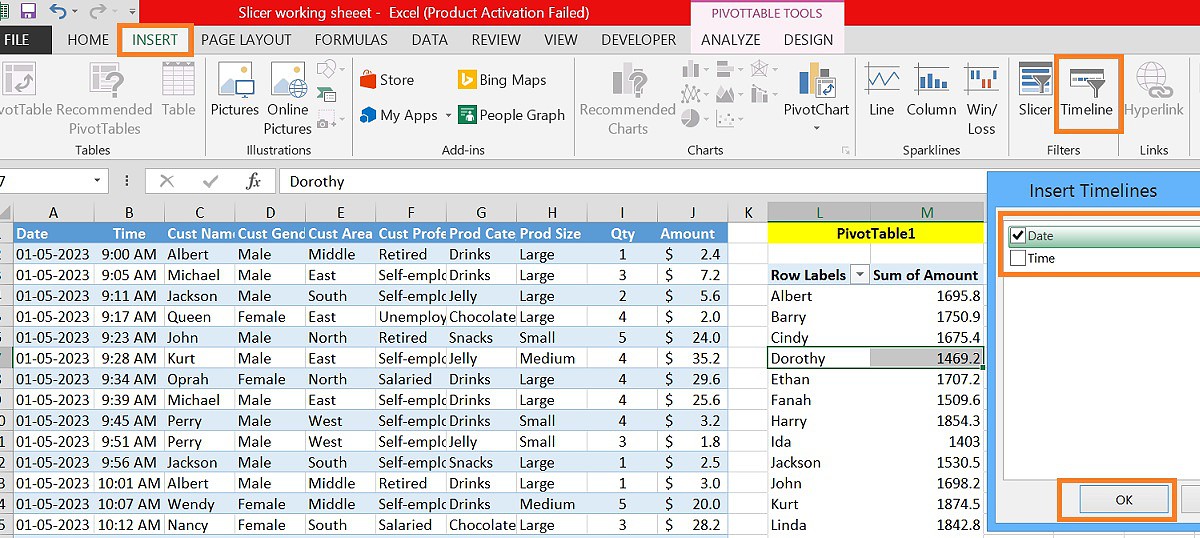
Click anywhere on the PivotTable or PivotChart to which you want to add a timeline slicer.
- Go to the Insert tab on the Excel ribbon and click Slicer in the Filters group.
 OR,
OR,
- Click anywhere on the PivotTable or PivotChart to which you want to add a timeline slicer.
- Select the Analyze tab on the Excel ribbon and click the Insert Timeline button in the Filter group.
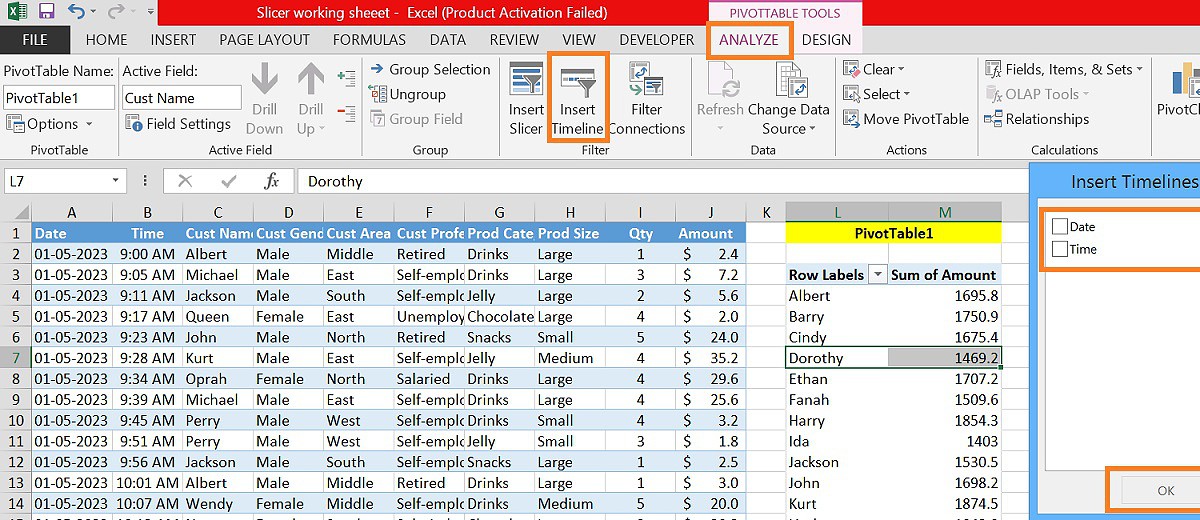
- The Insert Timelines pop-up window appears. A checkbox appears with a date or time column in the Insert Timelines dialog box. Select the date or time field you want to use as a timeline.
- Click OK.
- Now, the timeline appears as below.
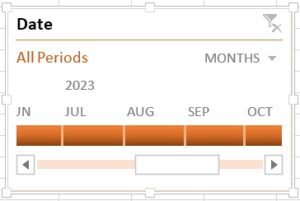
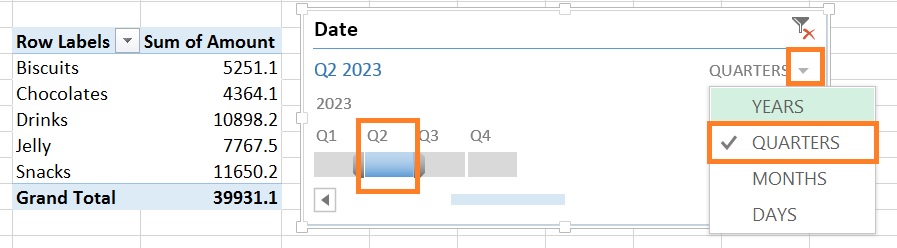
- For the timeline, you can configure or choose group dates by years, quarters, months, or days with the help of the drop-down list.
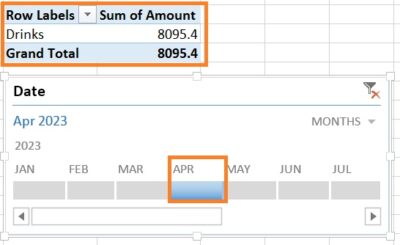
- If you want Timeline to filter the Pivot Table with the results of April month. To do this, click on “April” in the timeline slicer.
- Sales for the month of April will appear or be filtered.
- Now, select Quarters from the dropdown list. If quarterly data is not visible in the timeline, drag the blue box towards the end.
- Let’s select Q2 2023 to track various Cust names and their sale.
- You can also do same for Years & Days filter for display data accordingly.
- You can also change the Timeline Style, color, and other formatting options by following the below steps:
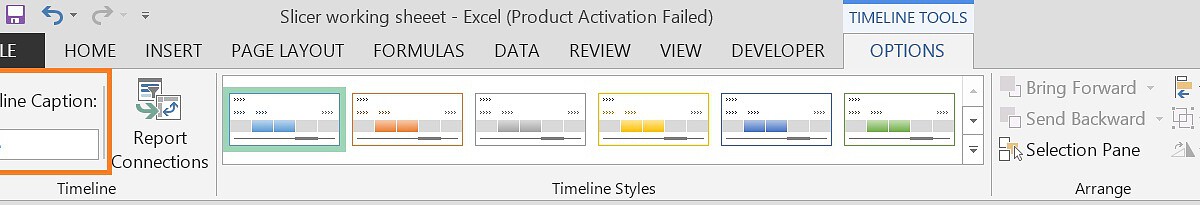
- Select Timeline, and then the Timeline Tool contextual tab will appear on the ribbon.
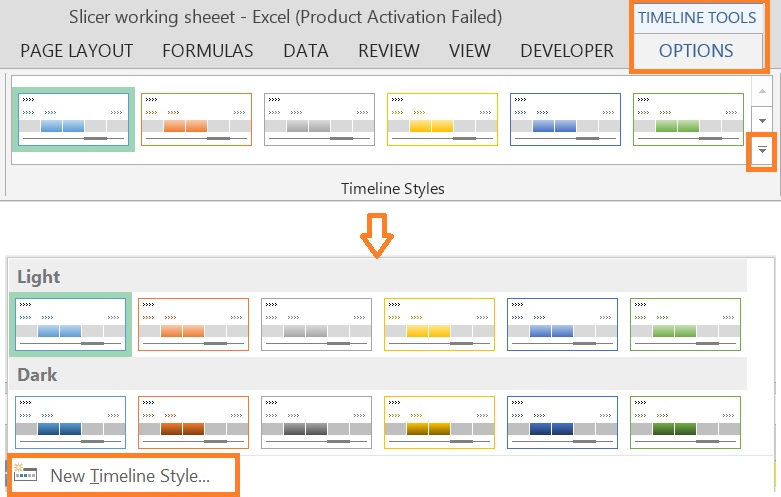
- On the Timeline Tools contextual tab, go to the Options.
- Use the Timeline Styles dropdown to apply a pre-defined style to your Timeline. These styles include various color schemes and designs.
- You can also customize the Timeline style as per your desire, you can do it by New Timeline Style…., That will open format timeline dialog box, where you can modify various formatting options, such as the Timeline’s font, border, border color, background color/effect/pattern, and so on.
- Scroll bar : This option appears in the Options tab and helps select periods. It also allows scrolling through the years, quarters, months, and days.
- Time level : This option allows selecting from four different time levels depending on preference. The four time levels are, namely–years, quarters, months, and days.
- Timeline header : This option displays the heading or the title of the timeline.
- Selection label : This option displays the date range that is included in the filter.
- Clear Filter : This button helps to clear all the “time” options like years, quarters, months or days.
- Timeline window size : The height and width of the PivotTable timeline can be adjusted as per requirement. It is also possible to resize the timeline window by dragging it beyond its borders.
- Timeline caption : By default, the caption box shows the column name as the caption. This is the column that was selected while inserting the timeline.
If you already have a Timeline on a pivot table, you can use the same Timeline to filter another pivot table.
Note: Timeline can only be connected to PivotTables that share the same data source.
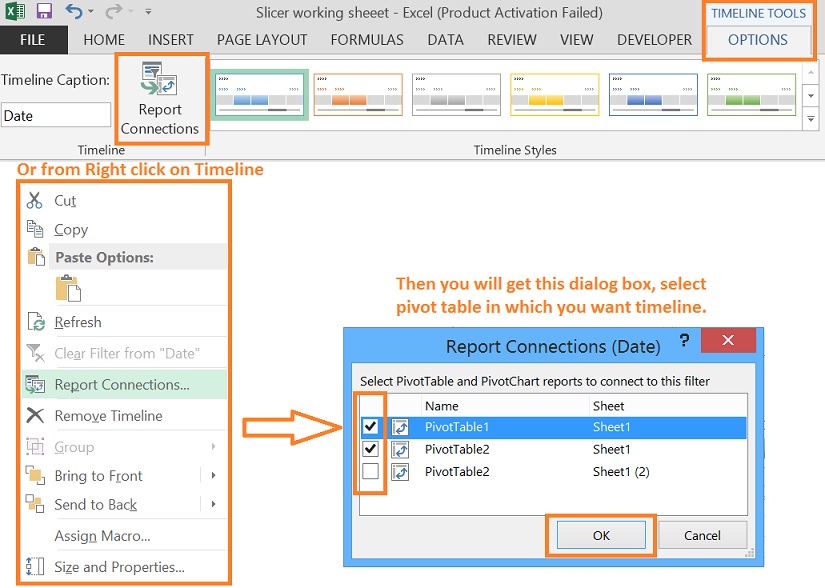
- Right-click on the Timeline, and then click Report Connections
- Alternatively, select the Timeline you want to share with another pivot table. This displays in the Options under the Timeline Tools tab.
- In the dialog box, select the check box of the Pivot Table in which you want the Timeline to be available. Now both pivot tables will respond to the Timeline selection.
- You can use the same approach to disconnect a timeline from any pivot table.